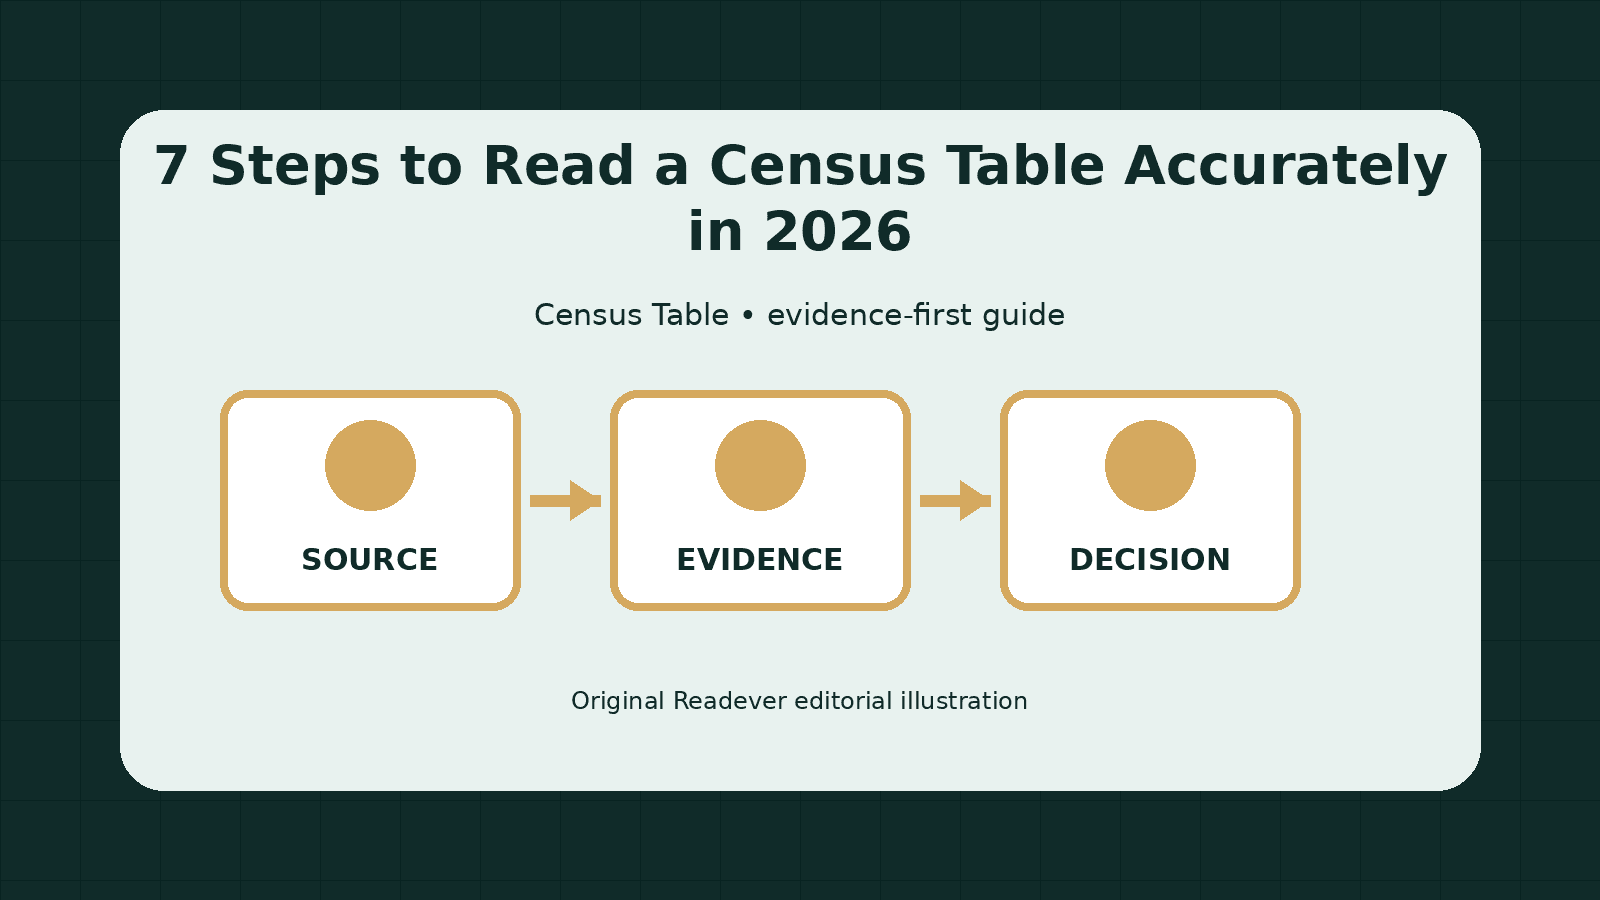
Census tables look authoritative, but the meaning of a number depends on the survey, universe, geography, period, estimate type, and uncertainty. A careful reading begins with the table notes and denominator, not with the largest or most surprising value.
🎯 Want to read data-literacy books for FREE with AI-powered assistance?
Open the Census Data Literacy book list in Readever — Read How to Lie with Statistics, Naked Statistics, and The Signal and the Noise while keeping claims connected to the exact tables and evidence behind them.
Identify survey, product, and vintage
Record whether the table comes from the decennial census, American Community Survey, population estimates, economic programs, or another product. Note the one-year or five-year period, release year, table identifier, and retrieval date. Different products answer different questions and may use different reference periods.
Read the universe before the categories
The universe defines who or what could be counted: people, households, workers, occupied units, or a narrower subgroup. Copy it into your notes before calculating a percentage. A category total divided by the wrong universe can produce a plausible but invalid rate, especially across age, tenure, employment, or household tables.
Check geography and boundary definitions
Distinguish states, counties, places, census tracts, block groups, metropolitan areas, and legislative or service areas. Boundary changes can break comparisons across years. Confirm whether a named area is incorporated, statistical, or custom, and whether the table uses residence, workplace, or another geographic basis.
Pair estimates with margins of error
For survey estimates, keep the margin of error beside the value and consider uncertainty when ranking places or describing change. Small geographies and subgroups often have larger relative uncertainty. Overlapping intervals do not settle every statistical question, but ignoring uncertainty makes small differences look more decisive than the data support.
Audit derived percentages and suppression
Determine whether a percentage is published or calculated, and preserve the denominator and rounding method. Note annotations for unavailable, suppressed, not applicable, or insufficient data. Zero, blank, dash, and estimate withheld are not interchangeable, so carry the table symbol and documentation into any downstream chart.
Compare only compatible measures
Before comparing periods or places, check questionnaire wording, inflation adjustment, category definitions, weighting, geography, and methodology changes. Save the table ID, filters, downloaded file, and notes. A reproducible citation should let another reader retrieve the same product and understand why the selected comparison is defensible.
Record the interpretation and its limits
Write the conclusion beside the exact cells, universe, geography, period, and uncertainty that support it. Separate what the table directly reports from calculations or explanations you added, and list unresolved questions such as missing categories, changed boundaries, or unstable estimates. This final record makes the reading auditable and prevents a qualified finding from becoming an unsupported general claim.
Mid-reading checkpoint: Use Readever’s AI reading assistant to compare the document’s key claims with its demographic evidence, while keeping interpretation separate from quoted evidence.
Frequently Asked Questions
Can AI replace the original material for public data literacy?
No. In public data literacy, use AI to organize comparisons and surface missing context, then verify every consequential claim against the cited original. Preserve the document date, scope, definitions, and uncertainty because those details determine whether an interpretation is defensible.
What belongs in an auditable public data literacy note?
Save the exact source and version, the decision or question being answered, relevant evidence, limitations, unresolved conflicts, and your reasoning. A reader should be able to reconstruct the public data literacy conclusion without depending on an assistant transcript.
What should I verify before relying on this census table?
Confirm the publisher, date, scope, definitions, revision status, and intended audience. Then trace each consequential conclusion to the supporting demographic evidence and record any missing context or unresolved conflict.
How can Readever help without replacing source review?
Readever can organize sections, connect notes to passages, and surface inconsistent terminology. The reader still checks the original document, validates calculations or claims, and decides whether specialist review is required.
Put the Reading Into Practice
Open the material in Readever and create a section map tailored to public data literacy. Attach each important claim to its supporting passage, label interpretation separately from direct evidence, and keep the page-specific questions visible until they are resolved by an authoritative source or qualified reviewer.